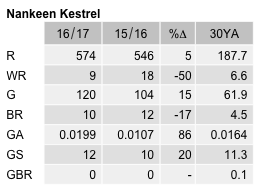
Nankeen Kestrel
Falco cenchroides
ABR description
The following is extracted from the Annual Bird Report for the twelve months to June 2017.
Uncommon, breeding resident
A common resident and breeding species, the most observed raptor in the region.
General: 590 records, including 9 WOO, making the kestrel the most recorded and the most numerous raptor in our region once again, though the Wedge-tailed Eagle is marginally more widespread. The reporting rate of 4.2% was the lowest since 2004 and down on the 30YA of 6.9. Numbers ranged from 1-9, average 1.4, median 1; max 9/29 Oct Callum Brae NR GrL15 (SmA1). Recorded in every week: winter 17%; spring 35%; summer 32%; and autumn 17%, the usual seasonal spread. Recorded from 120 widespread grid cells. As in most years, there were breeding records, 10 this time, from ih/20 Aug Wanniassa Hills NR GrK16 (CaR3) to dy/24 Jan MFNR GrL11 (ClJ3).
GBS: 50 records this year, an improvement on last year. The reporting rate was 1.9%, up on the 30YA of 1.5%. Kestrels were recorded in 34 weeks, and in all seasons, with the highest number of records again coming in autumn (50%). 10 urban and 2 rural sites were involved, though kestrels were not particularly common in any of them.
Abundance
Abundance is the average number of birds of that species per survey. Where the species was observed (presence recorded) but the number of birds seen was not recorded, this is treated as a count of zero.
Abundance by year
This chart shows the abundance of Nankeen Kestrel between 1982 and 2017. 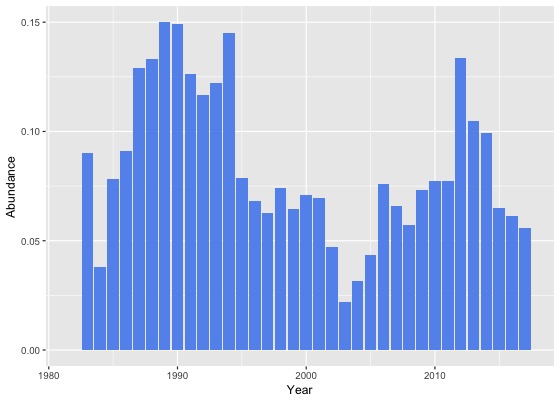
Abundance by month
This chart shows the monthly abundance of Nankeen Kestrel. The blue lines show the abundance for the twelve months to June 2017 and the bars show the average abundance for the period 1982 to 2017. 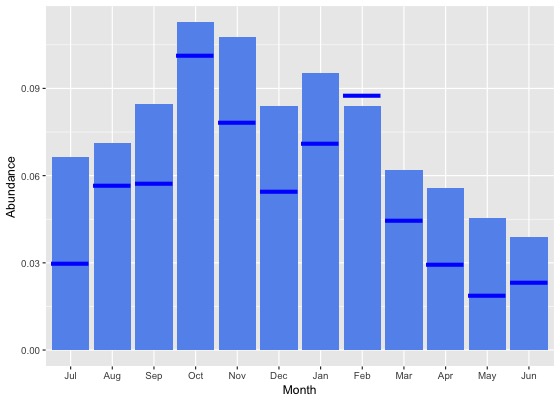
Abundance by season
This chart shows the seasonal abundance of Nankeen Kestrel. The blue lines show the seasonal abundance for the twelve months to June 2017 and the bars show the average seasonal abundance for the period 1982 to 2017. 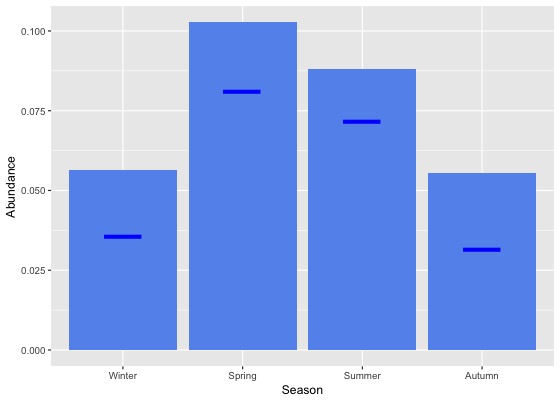
Abundance data
| Month | Season | ||||||||||||||||||
|---|---|---|---|---|---|---|---|---|---|---|---|---|---|---|---|---|---|---|---|
| Period | Jul | Aug | Sep | Oct | Nov | Dec | Jan | Feb | Mar | Apr | May | Jun | Winter | Spring | Summer | Autumn | All | ||
| All years | |||||||||||||||||||
| All | 0.1 | 0.1 | 0.1 | 0.1 | 0.1 | 0.1 | 0.1 | 0.1 | 0.1 | 0.1 | 0.0 | 0.0 | 0.1 | 0.1 | 0.1 | 0.1 | 0.1 | ||
| Previous years | |||||||||||||||||||
| All previous years | 0.1 | 0.1 | 0.1 | 0.1 | 0.1 | 0.1 | 0.1 | 0.1 | 0.1 | 0.1 | 0.1 | 0.0 | 0.1 | 0.1 | 0.1 | 0.1 | 0.1 | ||
| Previous 30 years | 0.1 | 0.1 | 0.1 | 0.1 | 0.1 | 0.1 | 0.1 | 0.1 | 0.1 | 0.1 | 0.1 | 0.0 | 0.1 | 0.1 | 0.1 | 0.1 | 0.1 | ||
| Previous 20 years | 0.1 | 0.1 | 0.1 | 0.1 | 0.1 | 0.1 | 0.1 | 0.1 | 0.1 | 0.1 | 0.0 | 0.0 | 0.0 | 0.1 | 0.1 | 0.1 | 0.1 | ||
| 10 year groups | |||||||||||||||||||
| [2007,2017) | 0.1 | 0.1 | 0.1 | 0.1 | 0.1 | 0.1 | 0.1 | 0.1 | 0.0 | 0.1 | 0.0 | 0.0 | 0.1 | 0.1 | 0.1 | 0.1 | 0.1 | ||
| [1997,2007) | 0.0 | 0.0 | 0.1 | 0.1 | 0.1 | 0.1 | 0.1 | 0.1 | 0.1 | 0.0 | 0.0 | 0.0 | 0.0 | 0.1 | 0.1 | 0.0 | 0.1 | ||
| [1987,1997) | 0.1 | 0.1 | 0.1 | 0.1 | 0.2 | 0.1 | 0.2 | 0.1 | 0.1 | 0.1 | 0.1 | 0.1 | 0.1 | 0.1 | 0.1 | 0.1 | 0.1 | ||
| 5 year groups | |||||||||||||||||||
| [2012,2017) | 0.1 | 0.1 | 0.1 | 0.1 | 0.1 | 0.1 | 0.1 | 0.1 | 0.1 | 0.1 | 0.0 | 0.0 | 0.1 | 0.1 | 0.1 | 0.1 | 0.1 | ||
| [2007,2012) | 0.1 | 0.0 | 0.1 | 0.1 | 0.1 | 0.1 | 0.1 | 0.1 | 0.0 | 0.0 | 0.0 | 0.0 | 0.0 | 0.1 | 0.1 | 0.0 | 0.1 | ||
| [2002,2007) | 0.0 | 0.0 | 0.1 | 0.1 | 0.1 | 0.0 | 0.0 | 0.0 | 0.1 | 0.0 | 0.0 | 0.0 | 0.0 | 0.1 | 0.0 | 0.0 | 0.0 | ||
| [1997,2002) | 0.0 | 0.0 | 0.1 | 0.1 | 0.1 | 0.1 | 0.1 | 0.1 | 0.1 | 0.0 | 0.0 | 0.0 | 0.0 | 0.1 | 0.1 | 0.0 | 0.1 | ||
| [1992,1997) | 0.1 | 0.1 | 0.1 | 0.1 | 0.2 | 0.1 | 0.2 | 0.1 | 0.1 | 0.1 | 0.1 | 0.1 | 0.1 | 0.1 | 0.1 | 0.1 | 0.1 | ||
| [1987,1992) | 0.1 | 0.1 | 0.1 | 0.2 | 0.1 | 0.2 | 0.2 | 0.1 | 0.1 | 0.1 | 0.1 | 0.1 | 0.1 | 0.2 | 0.1 | 0.1 | 0.1 | ||
| Year | |||||||||||||||||||
| 2017 | 0.0 | 0.1 | 0.1 | 0.1 | 0.1 | 0.1 | 0.1 | 0.1 | 0.0 | 0.0 | 0.0 | 0.0 | 0.0 | 0.1 | 0.1 | 0.0 | 0.1 | ||
| 2016 | 0.0 | 0.1 | 0.1 | 0.1 | 0.1 | 0.1 | 0.1 | 0.1 | 0.1 | 0.0 | 0.0 | 0.0 | 0.0 | 0.1 | 0.1 | 0.0 | 0.1 | ||
| 2015 | 0.1 | 0.1 | 0.1 | 0.1 | 0.1 | 0.1 | 0.1 | 0.0 | 0.0 | 0.0 | 0.0 | 0.1 | 0.1 | 0.1 | 0.1 | 0.0 | 0.1 | ||
| 2014 | 0.1 | 0.1 | 0.0 | 0.1 | 0.1 | 0.1 | 0.2 | 0.2 | 0.0 | 0.1 | 0.1 | 0.0 | 0.1 | 0.1 | 0.2 | 0.1 | 0.1 | ||
| 2013 | 0.1 | 0.1 | 0.1 | 0.1 | 0.2 | 0.1 | 0.1 | 0.1 | 0.1 | 0.1 | 0.1 | 0.0 | 0.1 | 0.1 | 0.1 | 0.1 | 0.1 | ||
| 2012 | 0.2 | 0.2 | 0.2 | 0.1 | 0.2 | 0.1 | 0.1 | 0.1 | 0.1 | 0.1 | 0.1 | 0.1 | 0.2 | 0.2 | 0.1 | 0.1 | 0.1 | ||
| 2011 | 0.1 | 0.0 | 0.1 | 0.2 | 0.1 | 0.1 | 0.1 | 0.1 | 0.0 | 0.1 | 0.1 | 0.0 | 0.1 | 0.1 | 0.1 | 0.0 | 0.1 | ||
| 2010 | 0.0 | 0.1 | 0.1 | 0.1 | 0.1 | 0.1 | 0.1 | 0.0 | 0.1 | 0.1 | 0.0 | 0.0 | 0.0 | 0.1 | 0.1 | 0.0 | 0.1 | ||
| 2009 | 0.0 | 0.0 | 0.1 | 0.1 | 0.1 | 0.1 | 0.1 | 0.1 | 0.0 | 0.1 | 0.1 | 0.0 | 0.0 | 0.1 | 0.1 | 0.1 | 0.1 | ||
| 2008 | 0.0 | 0.0 | 0.1 | 0.1 | 0.1 | 0.1 | 0.1 | 0.1 | 0.0 | 0.0 | 0.1 | 0.0 | 0.0 | 0.1 | 0.1 | 0.0 | 0.1 | ||
| 2007 | 0.1 | 0.0 | 0.1 | 0.1 | 0.1 | 0.1 | 0.1 | 0.2 | 0.0 | 0.0 | 0.0 | 0.0 | 0.0 | 0.1 | 0.1 | 0.0 | 0.1 | ||
| 2006 | 0.1 | 0.0 | 0.1 | 0.1 | 0.0 | 0.1 | 0.1 | 0.1 | 0.1 | 0.1 | 0.0 | 0.0 | 0.0 | 0.1 | 0.1 | 0.1 | 0.1 | ||
| 2005 | 0.0 | 0.0 | 0.1 | 0.1 | 0.1 | 0.0 | 0.0 | 0.0 | 0.0 | 0.1 | 0.0 | 0.0 | 0.0 | 0.1 | 0.0 | 0.0 | 0.0 | ||
| 2004 | 0.0 | 0.0 | 0.0 | 0.0 | 0.1 | 0.0 | 0.0 | 0.0 | 0.0 | 0.0 | 0.0 | 0.0 | 0.0 | 0.0 | 0.0 | 0.0 | 0.0 | ||
| 2003 | 0.0 | 0.0 | 0.0 | 0.0 | 0.0 | 0.0 | 0.0 | 0.0 | 0.0 | 0.0 | 0.0 | 0.0 | 0.0 | 0.0 | 0.0 | 0.0 | 0.0 | ||
| 2002 | 0.0 | 0.1 | 0.1 | 0.1 | 0.1 | 0.0 | 0.0 | 0.1 | 0.1 | 0.0 | 0.0 | 0.0 | 0.0 | 0.1 | 0.0 | 0.0 | 0.0 | ||
| 2001 | 0.0 | 0.0 | 0.1 | 0.1 | 0.1 | 0.1 | 0.1 | 0.1 | 0.1 | 0.0 | 0.0 | 0.0 | 0.0 | 0.1 | 0.1 | 0.0 | 0.1 | ||
| 2000 | 0.0 | 0.0 | 0.1 | 0.1 | 0.1 | 0.1 | 0.1 | 0.1 | 0.1 | 0.1 | 0.0 | 0.0 | 0.0 | 0.1 | 0.1 | 0.1 | 0.1 | ||
| 1999 | 0.1 | 0.0 | 0.1 | 0.2 | 0.1 | 0.1 | 0.1 | 0.1 | 0.0 | 0.0 | 0.0 | 0.0 | 0.0 | 0.1 | 0.1 | 0.0 | 0.1 | ||
| 1998 | 0.1 | 0.0 | 0.0 | 0.1 | 0.1 | 0.1 | 0.3 | 0.2 | 0.0 | 0.0 | 0.0 | 0.0 | 0.0 | 0.1 | 0.2 | 0.0 | 0.1 | ||
| 1997 | 0.0 | 0.0 | 0.1 | 0.1 | 0.1 | 0.1 | 0.2 | 0.0 | 0.0 | 0.0 | 0.0 | 0.0 | 0.0 | 0.1 | 0.1 | 0.0 | 0.1 | ||
| 1996 | 0.0 | 0.0 | 0.0 | 0.1 | 0.1 | 0.1 | 0.1 | 0.0 | 0.0 | 0.0 | 0.1 | 0.2 | 0.1 | 0.1 | 0.1 | 0.0 | 0.1 | ||
| 1995 | 0.1 | 0.0 | 0.0 | 0.1 | 0.1 | 0.1 | 0.2 | 0.0 | 0.2 | 0.1 | 0.0 | 0.0 | 0.0 | 0.1 | 0.1 | 0.1 | 0.1 | ||
| 1994 | 0.2 | 0.2 | 0.3 | 0.0 | 0.2 | 0.2 | 0.2 | 0.1 | 0.1 | 0.1 | 0.1 | 0.0 | 0.1 | 0.2 | 0.2 | 0.1 | 0.1 | ||
| 1993 | 0.1 | 0.1 | 0.1 | 0.1 | 0.2 | 0.3 | 0.1 | 0.0 | 0.0 | 0.1 | 0.1 | 0.1 | 0.1 | 0.2 | 0.2 | 0.1 | 0.1 | ||
| 1992 | 0.0 | 0.0 | 0.1 | 0.1 | 0.2 | 0.0 | 0.1 | 0.5 | 0.2 | 0.1 | 0.0 | 0.1 | 0.0 | 0.1 | 0.2 | 0.1 | 0.1 | ||
| 1991 | 0.1 | 0.1 | 0.1 | 0.1 | 0.2 | 0.1 | 0.3 | 0.4 | 0.1 | 0.1 | 0.1 | 0.1 | 0.1 | 0.1 | 0.2 | 0.1 | 0.1 | ||
| 1990 | 0.1 | 0.1 | 0.1 | 0.1 | 0.1 | 0.2 | 0.1 | 0.1 | 0.3 | 0.2 | 0.2 | 0.2 | 0.1 | 0.1 | 0.2 | 0.2 | 0.1 | ||
| 1989 | 0.1 | 0.2 | 0.2 | 0.2 | 0.2 | 0.2 | 0.2 | 0.1 | 0.1 | 0.1 | 0.1 | 0.1 | 0.1 | 0.2 | 0.2 | 0.1 | 0.1 | ||
| 1988 | 0.2 | 0.1 | 0.2 | 0.1 | 0.1 | 0.1 | 0.1 | 0.2 | 0.1 | 0.1 | 0.1 | 0.1 | 0.1 | 0.1 | 0.1 | 0.1 | 0.1 | ||
| 1987 | 0.2 | 0.0 | 0.1 | 0.2 | 0.1 | 0.1 | 0.2 | 0.1 | 0.1 | 0.1 | 0.1 | 0.1 | 0.1 | 0.2 | 0.1 | 0.1 | 0.1 | ||
| 1986 | 0.0 | 0.0 | 0.1 | 0.1 | 0.1 | 0.3 | 0.0 | 0.0 | 0.2 | 0.1 | 0.0 | 0.1 | 0.0 | 0.1 | 0.1 | 0.1 | 0.1 | ||
| 1985 | 0.0 | 0.1 | 0.0 | 0.1 | 0.0 | 0.0 | 0.2 | 0.2 | 0.3 | 0.3 | 0.2 | 0.1 | 0.1 | 0.0 | 0.1 | 0.2 | 0.1 | ||
| 1984 | 0.0 | 0.0 | 0.4 | 0.2 | 0.0 | 0.0 | 0.0 | 0.0 | 0.0 | 0.0 | 0.1 | 0.0 | 0.0 | 0.2 | 0.0 | 0.1 | 0.0 | ||
| 1983 | 0.0 | 0.0 | 0.0 | 0.0 | 0.1 | 0.1 | 1.2 | 0.0 | 0.0 | - | 0.0 | 0.0 | 0.0 | 0.0 | 0.3 | 0.0 | 0.1 | ||
| 1982 | - | 0.0 | - | 0.0 | 0.0 | 0.0 | - | 0.0 | - | 0.0 | - | 0.0 | 0.0 | 0.0 | 0.0 | 0.0 | 0.0 | ||
Reporting rates
Reporting rate is the proportion of all surveys in which the species was present.
Reporting rate by year
This chart shows the reporting rate of Nankeen Kestrel each year between 1982 and 2017. 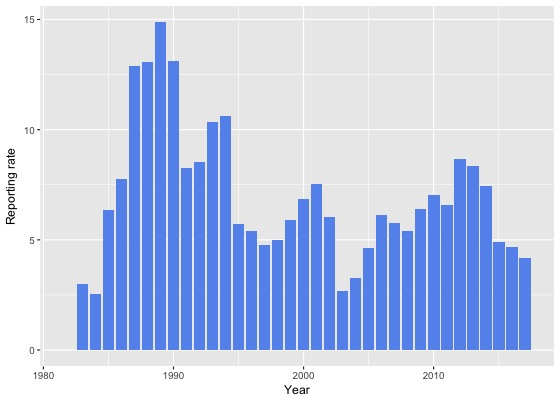
Reporting rate by month
This chart shows the reporting rate by month of Nankeen Kestrel. The blue lines show the reporting rate for the twelve months to June 2017 and the bars show the average reporting rate for the period 1982 to 2017. 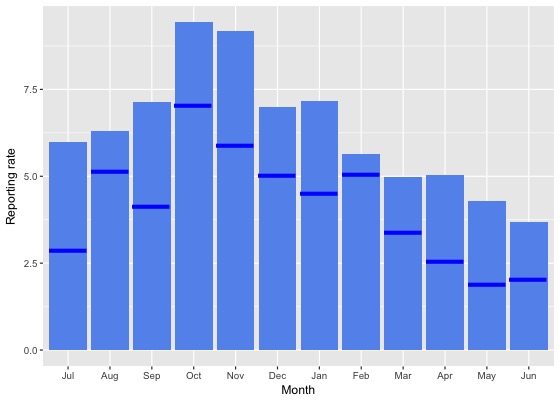
Reporting rate by season
This chart shows the seasonal reporting rate of Nankeen Kestrel. The blue lines show the seasonal reporting rate for the twelve months to June 2017 and the bars show the average seasonal reporting rate for the period 1982 to 2017. 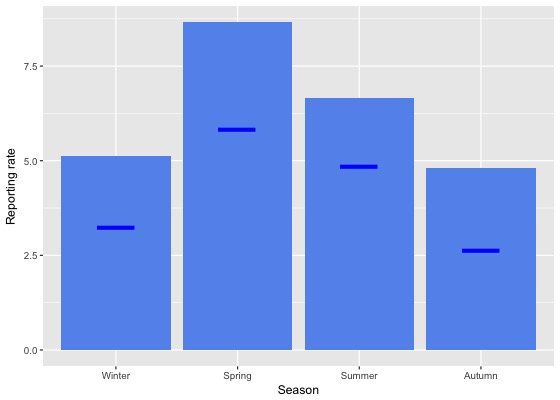
Reporting rate data
| Month | Season | ||||||||||||||||||
|---|---|---|---|---|---|---|---|---|---|---|---|---|---|---|---|---|---|---|---|
| Period | Jul | Aug | Sep | Oct | Nov | Dec | Jan | Feb | Mar | Apr | May | Jun | Winter | Spring | Summer | Autumn | All | ||
| All years | |||||||||||||||||||
| All | 6.0 | 6.3 | 7.1 | 9.4 | 9.2 | 7.0 | 7.2 | 5.6 | 5.0 | 5.0 | 4.3 | 3.7 | 5.1 | 8.7 | 6.7 | 4.8 | 6.5 | ||
| Previous years | |||||||||||||||||||
| All previous years | 6.5 | 6.5 | 7.5 | 9.8 | 9.7 | 7.3 | 7.7 | 5.8 | 5.3 | 5.4 | 4.8 | 4.0 | 5.5 | 9.1 | 7.0 | 5.2 | 6.9 | ||
| Previous 30 years | 6.5 | 6.6 | 7.6 | 9.8 | 9.8 | 7.3 | 7.7 | 5.8 | 5.2 | 5.4 | 4.8 | 4.0 | 5.5 | 9.1 | 7.0 | 5.2 | 6.9 | ||
| Previous 20 years | 5.4 | 5.5 | 6.5 | 9.1 | 8.6 | 6.2 | 6.7 | 5.1 | 4.3 | 4.5 | 4.1 | 3.1 | 4.4 | 8.2 | 6.1 | 4.3 | 6.0 | ||
| 10 year groups | |||||||||||||||||||
| [2007,2017) | 6.4 | 6.4 | 6.9 | 9.2 | 8.8 | 6.6 | 6.5 | 5.1 | 3.8 | 4.3 | 4.5 | 3.6 | 5.2 | 8.4 | 6.2 | 4.2 | 6.2 | ||
| [1997,2007) | 3.7 | 3.5 | 5.8 | 8.5 | 8.2 | 5.5 | 7.3 | 5.3 | 5.4 | 5.1 | 3.0 | 2.0 | 2.9 | 7.4 | 6.0 | 4.7 | 5.4 | ||
| [1987,1997) | 10.5 | 10.0 | 12.8 | 14.1 | 13.7 | 13.2 | 13.3 | 8.9 | 10.5 | 9.8 | 7.7 | 8.7 | 9.7 | 13.6 | 11.9 | 9.4 | 11.3 | ||
| 5 year groups | |||||||||||||||||||
| [2012,2017) | 6.8 | 7.0 | 6.8 | 8.9 | 8.5 | 6.9 | 6.5 | 4.8 | 3.9 | 4.3 | 4.2 | 4.1 | 5.8 | 8.2 | 6.1 | 4.1 | 6.1 | ||
| [2007,2012) | 5.2 | 3.9 | 7.1 | 9.7 | 9.6 | 6.1 | 6.8 | 6.3 | 3.6 | 4.4 | 5.4 | 2.8 | 3.6 | 9.0 | 6.4 | 4.3 | 6.3 | ||
| [2002,2007) | 3.7 | 3.4 | 4.8 | 6.8 | 6.3 | 4.3 | 4.2 | 4.8 | 5.2 | 5.0 | 3.5 | 1.9 | 2.9 | 6.0 | 4.4 | 4.8 | 4.6 | ||
| [1997,2002) | 3.7 | 3.6 | 7.0 | 11.0 | 10.3 | 7.1 | 10.7 | 5.7 | 5.6 | 5.2 | 2.4 | 2.0 | 3.0 | 9.3 | 7.8 | 4.7 | 6.5 | ||
| [1992,1997) | 7.1 | 4.6 | 8.7 | 9.4 | 13.0 | 7.9 | 10.2 | 5.4 | 7.5 | 6.8 | 4.9 | 6.0 | 5.8 | 10.4 | 8.1 | 6.5 | 7.8 | ||
| [1987,1992) | 12.1 | 12.8 | 14.8 | 16.8 | 14.0 | 15.5 | 14.9 | 10.3 | 12.3 | 11.5 | 9.1 | 10.2 | 11.8 | 15.2 | 13.6 | 11.0 | 13.0 | ||
| Year | |||||||||||||||||||
| 2017 | 2.9 | 5.2 | 4.1 | 7.0 | 5.9 | 5.0 | 4.5 | 5.1 | 3.4 | 2.6 | 1.9 | 2.0 | 3.2 | 5.8 | 4.8 | 2.6 | 4.2 | ||
| 2016 | 4.4 | 5.4 | 5.7 | 7.7 | 6.3 | 4.9 | 4.2 | 4.2 | 4.9 | 2.9 | 2.1 | 2.0 | 4.0 | 6.7 | 4.4 | 3.4 | 4.7 | ||
| 2015 | 6.5 | 6.7 | 5.4 | 8.3 | 4.3 | 5.6 | 5.0 | 2.8 | 2.0 | 4.0 | 3.5 | 4.7 | 5.7 | 6.3 | 4.5 | 3.1 | 4.9 | ||
| 2014 | 5.5 | 6.7 | 4.9 | 10.0 | 11.5 | 8.1 | 11.3 | 7.7 | 3.8 | 5.9 | 7.4 | 2.6 | 4.5 | 8.8 | 9.6 | 5.3 | 7.4 | ||
| 2013 | 7.3 | 9.5 | 10.8 | 11.1 | 16.4 | 9.5 | 7.4 | 6.5 | 4.6 | 5.3 | 4.6 | 3.6 | 6.5 | 12.5 | 8.0 | 4.9 | 8.4 | ||
| 2012 | 13.8 | 11.0 | 9.8 | 9.2 | 10.4 | 8.9 | 6.8 | 5.4 | 4.2 | 6.3 | 10.7 | 9.3 | 11.2 | 9.6 | 7.2 | 6.4 | 8.7 | ||
| 2011 | 5.7 | 4.8 | 9.7 | 12.3 | 9.7 | 3.9 | 5.6 | 4.1 | 2.2 | 6.6 | 6.2 | 5.2 | 5.2 | 11.1 | 4.6 | 4.9 | 6.6 | ||
| 2010 | 6.2 | 4.4 | 4.9 | 12.4 | 10.0 | 8.4 | 7.7 | 5.9 | 4.7 | 5.5 | 3.9 | 1.9 | 3.4 | 9.8 | 7.8 | 4.9 | 7.1 | ||
| 2009 | 2.2 | 3.1 | 8.6 | 10.3 | 7.1 | 6.9 | 4.0 | 5.8 | 3.7 | 6.1 | 6.1 | 1.8 | 2.2 | 9.2 | 5.7 | 5.3 | 6.4 | ||
| 2008 | 2.8 | 1.7 | 6.7 | 6.4 | 8.7 | 7.2 | 10.3 | 7.4 | 4.3 | 0.9 | 6.3 | 4.2 | 3.2 | 6.8 | 8.1 | 2.9 | 5.4 | ||
| 2007 | 12.1 | 5.6 | 5.4 | 7.5 | 13.5 | 5.0 | 7.5 | 10.4 | 3.4 | 3.0 | 3.3 | 0.7 | 3.8 | 7.9 | 6.9 | 3.2 | 5.8 | ||
| 2006 | 7.2 | 2.9 | 4.8 | 7.9 | 4.8 | 4.5 | 6.2 | 8.9 | 9.1 | 7.0 | 3.6 | 2.7 | 4.1 | 6.4 | 6.3 | 7.4 | 6.1 | ||
| 2005 | 2.9 | 1.9 | 4.1 | 6.1 | 8.3 | 3.6 | 4.3 | 3.3 | 5.2 | 7.7 | 6.5 | 1.9 | 2.2 | 5.7 | 3.7 | 6.3 | 4.6 | ||
| 2004 | 2.0 | 2.0 | 2.9 | 4.7 | 7.0 | 3.2 | 2.4 | 4.0 | 2.1 | 4.9 | 1.9 | 2.5 | 2.1 | 4.7 | 3.1 | 3.1 | 3.3 | ||
| 2003 | 4.3 | 0.7 | 3.0 | 5.2 | 4.1 | 3.0 | 3.0 | 2.2 | 2.7 | 1.8 | 1.6 | 0.0 | 1.4 | 4.0 | 2.7 | 2.1 | 2.7 | ||
| 2002 | 3.4 | 10.2 | 10.0 | 8.6 | 8.0 | 6.5 | 5.0 | 5.9 | 4.5 | 4.2 | 1.2 | 2.2 | 4.6 | 8.8 | 6.0 | 3.8 | 6.0 | ||
| 2001 | 5.3 | 5.4 | 8.3 | 14.3 | 9.7 | 10.1 | 11.5 | 7.7 | 6.6 | 3.9 | 2.9 | 2.0 | 4.2 | 10.5 | 9.9 | 4.9 | 7.5 | ||
| 2000 | 0.8 | 2.6 | 8.8 | 9.7 | 15.3 | 4.0 | 8.3 | 4.3 | 6.9 | 9.7 | 3.6 | 2.7 | 2.2 | 11.2 | 5.5 | 7.4 | 6.8 | ||
| 1999 | 8.8 | 1.0 | 5.2 | 11.3 | 9.1 | 10.0 | 10.9 | 5.7 | 4.9 | 3.6 | 1.7 | 2.3 | 2.6 | 8.4 | 8.9 | 3.4 | 5.9 | ||
| 1998 | 5.4 | 3.8 | 4.9 | 7.6 | 8.0 | 4.7 | 13.2 | 5.7 | 0.0 | 0.0 | 0.0 | 1.3 | 3.0 | 6.7 | 7.5 | 0.0 | 5.0 | ||
| 1997 | 1.1 | 5.2 | 4.5 | 7.9 | 6.0 | 5.8 | 15.7 | 3.5 | 5.0 | 2.8 | 2.2 | 0.0 | 1.8 | 5.9 | 7.5 | 3.1 | 4.8 | ||
| 1996 | 1.5 | 3.2 | 4.0 | 7.9 | 5.6 | 4.0 | 10.7 | 3.5 | 1.0 | 3.1 | 6.9 | 11.5 | 5.6 | 6.1 | 6.3 | 3.1 | 5.4 | ||
| 1995 | 8.6 | 1.6 | 1.9 | 11.0 | 4.5 | 5.7 | 9.7 | 1.6 | 10.2 | 7.3 | 0.0 | 1.1 | 3.5 | 6.6 | 6.5 | 6.4 | 5.7 | ||
| 1994 | 17.6 | 9.1 | 16.2 | 4.7 | 22.1 | 10.9 | 14.7 | 6.9 | 10.2 | 6.9 | 5.0 | 2.2 | 8.3 | 15.5 | 11.0 | 7.4 | 10.6 | ||
| 1993 | 8.2 | 7.7 | 12.9 | 13.3 | 13.6 | 21.7 | 10.2 | 0.0 | 4.9 | 10.0 | 9.1 | 11.6 | 9.2 | 13.3 | 11.8 | 7.8 | 10.3 | ||
| 1992 | 1.5 | 3.7 | 11.8 | 9.6 | 19.4 | 4.8 | 5.2 | 17.1 | 12.7 | 6.8 | 3.9 | 5.0 | 3.4 | 13.1 | 8.0 | 7.8 | 8.5 | ||
| 1991 | 7.1 | 5.3 | 5.8 | 7.8 | 13.4 | 8.1 | 14.3 | 16.0 | 7.9 | 3.4 | 6.6 | 6.0 | 6.3 | 9.1 | 12.2 | 6.0 | 8.3 | ||
| 1990 | 10.3 | 11.4 | 6.5 | 12.2 | 13.1 | 22.2 | 11.1 | 12.7 | 20.5 | 16.7 | 12.3 | 14.5 | 11.5 | 10.7 | 15.3 | 16.7 | 13.1 | ||
| 1989 | 10.2 | 17.2 | 19.2 | 24.2 | 15.7 | 17.8 | 16.5 | 10.8 | 12.2 | 11.8 | 4.6 | 10.1 | 12.9 | 20.1 | 15.2 | 9.9 | 14.9 | ||
| 1988 | 17.2 | 13.4 | 20.2 | 12.9 | 13.5 | 14.4 | 14.1 | 12.0 | 11.4 | 12.3 | 8.6 | 6.8 | 12.7 | 14.9 | 13.5 | 10.7 | 13.1 | ||
| 1987 | 18.2 | 0.0 | 13.0 | 18.4 | 14.0 | 14.2 | 15.9 | 6.7 | 11.0 | 10.7 | 12.2 | 13.2 | 12.6 | 15.0 | 11.9 | 11.3 | 12.9 | ||
| 1986 | 0.0 | 2.6 | 7.5 | 11.1 | 14.9 | 17.6 | 4.3 | 5.6 | 6.5 | 9.8 | 0.0 | 5.7 | 3.0 | 11.0 | 9.7 | 6.3 | 7.7 | ||
| 1985 | 0.0 | 6.7 | 3.8 | 4.7 | 0.0 | 5.0 | 12.5 | 17.6 | 27.3 | 26.3 | 20.0 | 3.6 | 3.4 | 3.1 | 8.2 | 25.0 | 6.4 | ||
| 1984 | 0.0 | 0.0 | 20.0 | 8.3 | 0.0 | 0.0 | 0.0 | 0.0 | 3.7 | 2.9 | 6.5 | 0.0 | 0.0 | 9.5 | 0.0 | 4.3 | 2.5 | ||
| 1983 | 0.0 | 0.0 | 0.0 | 0.0 | 11.1 | 7.7 | 16.7 | 0.0 | 0.0 | - | 0.0 | 0.0 | 0.0 | 3.7 | 6.7 | 0.0 | 3.0 | ||
| 1982 | - | 0.0 | - | 0.0 | 0.0 | 0.0 | - | 0.0 | - | 0.0 | - | 0.0 | 0.0 | 0.0 | 0.0 | 0.0 | 0.0 | ||
Breeding data
Breeding records by month
Number of breeding records by breeding code and month, 2017 and all years| Breeding code | Jul | Aug | Sep | Oct | Nov | Dec | Jan | Feb | Mar | Apr | May | Jun |
|---|---|---|---|---|---|---|---|---|---|---|---|---|
| 2017 | ||||||||||||
| Breeding (BLA code) | 0 | 0 | 0 | 0 | 0 | 0 | 0 | 0 | 0 | 0 | 0 | 0 |
| Carrying Food | 0 | 0 | 0 | 0 | 0 | 0 | 0 | 0 | 0 | 0 | 0 | 0 |
| Copulating | 0 | 0 | 0 | 0 | 0 | 0 | 0 | 0 | 0 | 0 | 0 | 0 |
| Display | 0 | 0 | 2 | 0 | 0 | 0 | 0 | 0 | 0 | 0 | 0 | 0 |
| Dependent young | 0 | 0 | 0 | 1 | 0 | 0 | 1 | 0 | 0 | 0 | 0 | 0 |
| Faecal sac | 0 | 0 | 0 | 0 | 0 | 0 | 0 | 0 | 0 | 0 | 0 | 0 |
| Inspecting hollow | 0 | 1 | 3 | 1 | 0 | 0 | 0 | 0 | 0 | 0 | 0 | 0 |
| Nest building | 0 | 0 | 0 | 0 | 0 | 0 | 0 | 0 | 0 | 0 | 0 | 0 |
| Nest with eggs | 0 | 0 | 0 | 0 | 0 | 0 | 0 | 0 | 0 | 0 | 0 | 0 |
| Nest with young | 0 | 0 | 0 | 1 | 0 | 0 | 0 | 0 | 0 | 0 | 0 | 0 |
| On/leaving nest | 0 | 0 | 0 | 0 | 0 | 0 | 0 | 0 | 0 | 0 | 0 | 0 |
| All years | ||||||||||||
| Breeding (BLA code) | 0 | 1 | 0 | 3 | 15 | 7 | 3 | 0 | 0 | 0 | 0 | 0 |
| Carrying Food | 0 | 0 | 1 | 2 | 0 | 3 | 1 | 0 | 0 | 0 | 0 | 0 |
| Copulating | 2 | 3 | 3 | 8 | 1 | 0 | 0 | 0 | 0 | 0 | 0 | 0 |
| Display | 1 | 0 | 4 | 5 | 1 | 0 | 0 | 0 | 0 | 0 | 0 | 1 |
| Dependent young | 0 | 0 | 1 | 4 | 5 | 14 | 7 | 2 | 0 | 0 | 0 | 0 |
| Faecal sac | 0 | 0 | 0 | 0 | 0 | 0 | 0 | 0 | 0 | 0 | 0 | 0 |
| Inspecting hollow | 0 | 4 | 6 | 5 | 1 | 0 | 0 | 0 | 0 | 0 | 0 | 0 |
| Nest building | 0 | 0 | 1 | 1 | 2 | 0 | 1 | 0 | 0 | 0 | 0 | 0 |
| Nest with eggs | 0 | 0 | 0 | 1 | 0 | 1 | 0 | 0 | 0 | 0 | 0 | 0 |
| Nest with young | 0 | 0 | 1 | 2 | 3 | 4 | 1 | 0 | 0 | 0 | 0 | 0 |
| On/leaving nest | 0 | 0 | 2 | 8 | 1 | 1 | 1 | 0 | 0 | 0 | 0 | 0 |
Breeding records by year
Average number of breeding records per period by breeding code| Period | Breeding (BLA code) | Carrying Food | Copulating | Display | Dependent young | Faecal sac | Inspecting hollow | Nest building | Nest with eggs | Nest with young | On/leaving nest |
|---|---|---|---|---|---|---|---|---|---|---|---|
| All years | |||||||||||
| All | 0.8 | 0.2 | 0.5 | 0.3 | 0.9 | 0.0 | 0.4 | 0.1 | 0.1 | 0.3 | 0.4 |
| Previous years | |||||||||||
| All previous years | 0.8 | 0.2 | 0.5 | 0.3 | 0.9 | 0.0 | 0.3 | 0.1 | 0.1 | 0.3 | 0.4 |
| Previous 30 years | 1.0 | 0.2 | 0.6 | 0.3 | 1.0 | 0.0 | 0.4 | 0.2 | 0.1 | 0.3 | 0.4 |
| Previous 20 years | 1.4 | 0.3 | 0.8 | 0.5 | 1.1 | 0.0 | 0.6 | 0.0 | 0.0 | 0.2 | 0.5 |
| 10 year groups | |||||||||||
| [2007,2017) | 0.2 | 0.4 | 1.3 | 1.0 | 1.0 | 0.0 | 0.9 | 0.0 | 0.0 | 0.3 | 0.7 |
| [1997,2007) | 2.7 | 0.2 | 0.3 | 0.0 | 1.1 | 0.0 | 0.2 | 0.1 | 0.0 | 0.2 | 0.3 |
| [1987,1997) | 0.0 | 0.1 | 0.1 | 0.0 | 1.0 | 0.0 | 0.0 | 0.4 | 0.2 | 0.5 | 0.3 |
| 5 year groups | |||||||||||
| [2012,2017) | 0.2 | 0.8 | 2.2 | 1.6 | 1.0 | 0.0 | 1.2 | 0.0 | 0.0 | 0.6 | 1.0 |
| [2007,2012) | 0.2 | 0.0 | 0.4 | 0.4 | 1.0 | 0.0 | 0.6 | 0.0 | 0.0 | 0.0 | 0.4 |
| [2002,2007) | 0.4 | 0.0 | 0.6 | 0.0 | 0.8 | 0.0 | 0.2 | 0.2 | 0.0 | 0.0 | 0.4 |
| [1997,2002) | 5.0 | 0.4 | 0.0 | 0.0 | 1.4 | 0.0 | 0.2 | 0.0 | 0.0 | 0.4 | 0.2 |
| [1992,1997) | 0.0 | 0.0 | 0.2 | 0.0 | 0.4 | 0.0 | 0.0 | 0.0 | 0.0 | 0.0 | 0.6 |
| [1987,1992) | 0.0 | 0.2 | 0.0 | 0.0 | 1.6 | 0.0 | 0.0 | 0.8 | 0.4 | 1.0 | 0.0 |
| Year | |||||||||||
| 2017 | 0.0 | 0.0 | 0.0 | 2.0 | 2.0 | 0.0 | 5.0 | 0.0 | 0.0 | 1.0 | 0.0 |
| 2016 | 0.0 | 1.0 | 0.0 | 4.0 | 1.0 | 0.0 | 4.0 | 0.0 | 0.0 | 2.0 | 0.0 |
| 2015 | 0.0 | 0.0 | 2.0 | 2.0 | 1.0 | 0.0 | 0.0 | 0.0 | 0.0 | 0.0 | 2.0 |
| 2014 | 0.0 | 1.0 | 1.0 | 0.0 | 0.0 | 0.0 | 0.0 | 0.0 | 0.0 | 0.0 | 0.0 |
| 2013 | 0.0 | 2.0 | 2.0 | 1.0 | 0.0 | 0.0 | 1.0 | 0.0 | 0.0 | 1.0 | 0.0 |
| 2012 | 1.0 | 0.0 | 6.0 | 1.0 | 3.0 | 0.0 | 1.0 | 0.0 | 0.0 | 0.0 | 3.0 |
| 2011 | 0.0 | 0.0 | 0.0 | 0.0 | 3.0 | 0.0 | 1.0 | 0.0 | 0.0 | 0.0 | 0.0 |
| 2010 | 1.0 | 0.0 | 2.0 | 0.0 | 0.0 | 0.0 | 0.0 | 0.0 | 0.0 | 0.0 | 0.0 |
| 2009 | 0.0 | 0.0 | 0.0 | 2.0 | 0.0 | 0.0 | 0.0 | 0.0 | 0.0 | 0.0 | 1.0 |
| 2008 | 0.0 | 0.0 | 0.0 | 0.0 | 0.0 | 0.0 | 0.0 | 0.0 | 0.0 | 0.0 | 1.0 |
| 2007 | 0.0 | 0.0 | 0.0 | 0.0 | 2.0 | 0.0 | 2.0 | 0.0 | 0.0 | 0.0 | 0.0 |
| 2006 | 0.0 | 0.0 | 0.0 | 0.0 | 2.0 | 0.0 | 0.0 | 0.0 | 0.0 | 0.0 | 1.0 |
| 2005 | 0.0 | 0.0 | 3.0 | 0.0 | 0.0 | 0.0 | 0.0 | 0.0 | 0.0 | 0.0 | 0.0 |
| 2004 | 0.0 | 0.0 | 0.0 | 0.0 | 0.0 | 0.0 | 0.0 | 0.0 | 0.0 | 0.0 | 1.0 |
| 2003 | 0.0 | 0.0 | 0.0 | 0.0 | 0.0 | 0.0 | 1.0 | 0.0 | 0.0 | 0.0 | 0.0 |
| 2002 | 2.0 | 0.0 | 0.0 | 0.0 | 2.0 | 0.0 | 0.0 | 1.0 | 0.0 | 0.0 | 0.0 |
| 2001 | 4.0 | 1.0 | 0.0 | 0.0 | 2.0 | 0.0 | 1.0 | 0.0 | 0.0 | 2.0 | 0.0 |
| 2000 | 17.0 | 0.0 | 0.0 | 0.0 | 1.0 | 0.0 | 0.0 | 0.0 | 0.0 | 0.0 | 1.0 |
| 1999 | 4.0 | 1.0 | 0.0 | 0.0 | 0.0 | 0.0 | 0.0 | 0.0 | 0.0 | 0.0 | 0.0 |
| 1998 | 0.0 | 0.0 | 0.0 | 0.0 | 1.0 | 0.0 | 0.0 | 0.0 | 0.0 | 0.0 | 0.0 |
| 1997 | 0.0 | 0.0 | 0.0 | 0.0 | 3.0 | 0.0 | 0.0 | 0.0 | 0.0 | 0.0 | 0.0 |
| 1996 | 0.0 | 0.0 | 0.0 | 0.0 | 1.0 | 0.0 | 0.0 | 0.0 | 0.0 | 0.0 | 2.0 |
| 1995 | 0.0 | 0.0 | 0.0 | 0.0 | 1.0 | 0.0 | 0.0 | 0.0 | 0.0 | 0.0 | 0.0 |
| 1994 | 0.0 | 0.0 | 1.0 | 0.0 | 0.0 | 0.0 | 0.0 | 0.0 | 0.0 | 0.0 | 0.0 |
| 1993 | 0.0 | 0.0 | 0.0 | 0.0 | 0.0 | 0.0 | 0.0 | 0.0 | 0.0 | 0.0 | 1.0 |
| 1992 | 0.0 | 0.0 | 0.0 | 0.0 | 0.0 | 0.0 | 0.0 | 0.0 | 0.0 | 0.0 | 0.0 |
| 1991 | 0.0 | 0.0 | 0.0 | 0.0 | 0.0 | 0.0 | 0.0 | 0.0 | 0.0 | 0.0 | 0.0 |
| 1990 | 0.0 | 1.0 | 0.0 | 0.0 | 3.0 | 0.0 | 0.0 | 0.0 | 0.0 | 3.0 | 0.0 |
| 1989 | 0.0 | 0.0 | 0.0 | 0.0 | 3.0 | 0.0 | 0.0 | 1.0 | 1.0 | 2.0 | 0.0 |
| 1988 | 0.0 | 0.0 | 0.0 | 0.0 | 2.0 | 0.0 | 0.0 | 2.0 | 0.0 | 0.0 | 0.0 |
| 1987 | 0.0 | 0.0 | 0.0 | 0.0 | 0.0 | 0.0 | 0.0 | 1.0 | 1.0 | 0.0 | 0.0 |
| 1986 | 0.0 | 0.0 | 0.0 | 0.0 | 0.0 | 0.0 | 0.0 | 0.0 | 0.0 | 0.0 | 0.0 |
| 1985 | 0.0 | 0.0 | 0.0 | 0.0 | 0.0 | 0.0 | 0.0 | 0.0 | 0.0 | 0.0 | 0.0 |
| 1984 | 0.0 | 0.0 | 0.0 | 0.0 | 0.0 | 0.0 | 0.0 | 0.0 | 0.0 | 0.0 | 0.0 |
| 1983 | 0.0 | 0.0 | 0.0 | 0.0 | 0.0 | 0.0 | 0.0 | 0.0 | 0.0 | 0.0 | 0.0 |
| 1982 | 0.0 | 0.0 | 0.0 | 0.0 | 0.0 | 0.0 | 0.0 | 0.0 | 0.0 | 0.0 | 0.0 |
Distribution map
Distribution - 2017
This map shows the observed distribution of the Nankeen Kestrel for 2017.
The red circles are the grid cells where Nankeen Kestrel have been reported.
The transparency of the red circles indicate how many surveys sheets were submitted for that grid cell; the darker the red the more reliable the data. Of the 315 grid cells with reports, 83 had only one sheet; an example is grid number E3.
The size of the circle represents the reporting rate. The maximum reporting rate for Nankeen Kestrel was 100.0% (eg grid number E3) and the minimum was 0.1% (eg grid number K13). 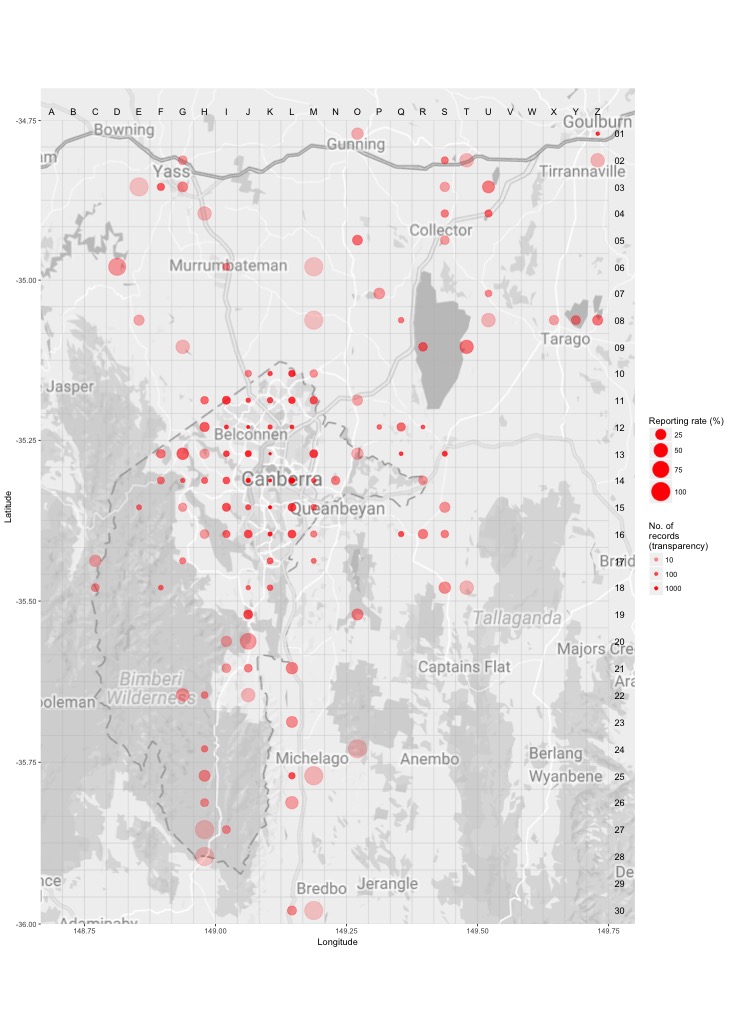
Distribution - all years
This map shows the observed distribution of the Nankeen Kestrel for all years.
The red circles are the grid cells where Nankeen Kestrel have been reported.
The transparency of the red circles indicate how many surveys sheets were submitted for that grid cell; the darker the red the more reliable the data. Of the 703 grid cells with reports, 55 had only one sheet; an example is grid number E27.
The size of the circle represents the reporting rate. The maximum reporting rate for Nankeen Kestrel was 100.0% (eg grid number E27) and the minimum was 0.3% (eg grid number K13). 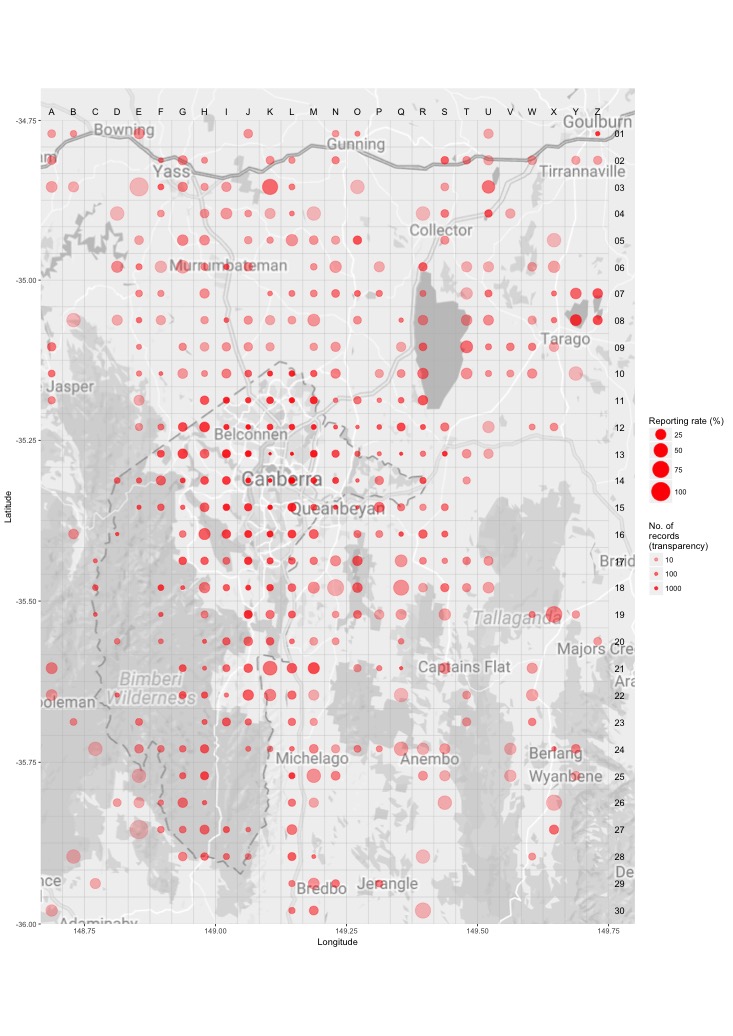
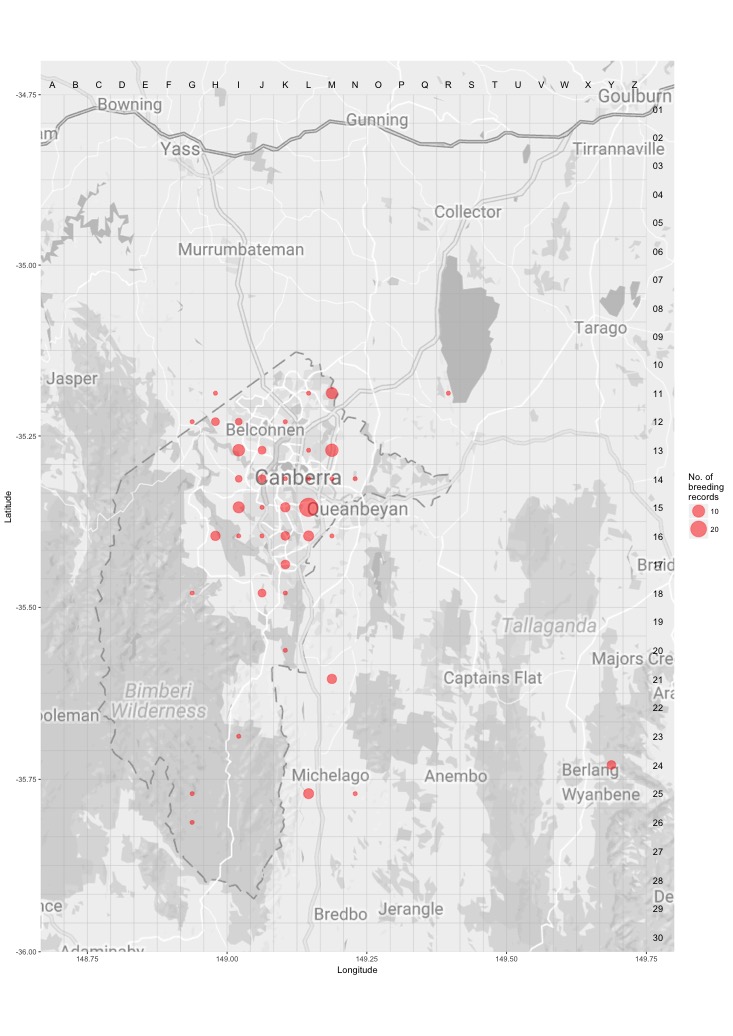
Breeding map
Breeding - 2017
This map shows the breeding distribution of the Nankeen Kestrel for 2017.
The red circles are the grid cells where breeding activity for Nankeen Kestrel have been reported.
The size of the circle represents the number of reports. 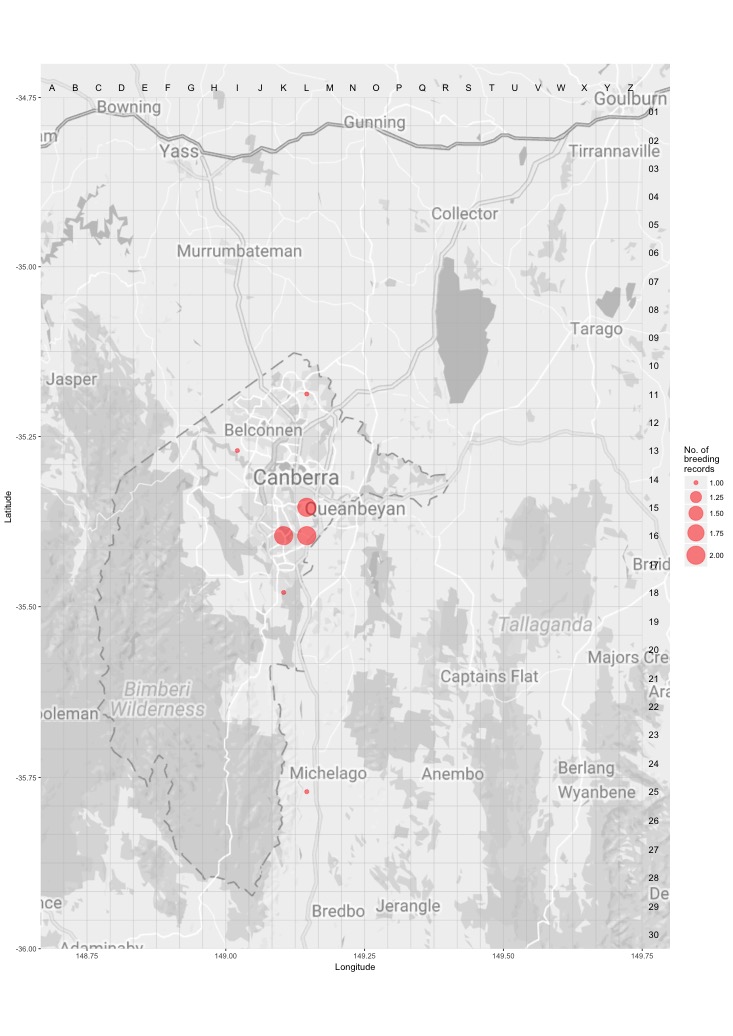
Breeding - all years
This map shows the breeding distribution of the Nankeen Kestrel for all years.
The red circles are the grid cells where breeding activity for Nankeen Kestrel have been reported.
The size of the circle represents the number of reports.